What the numbers show
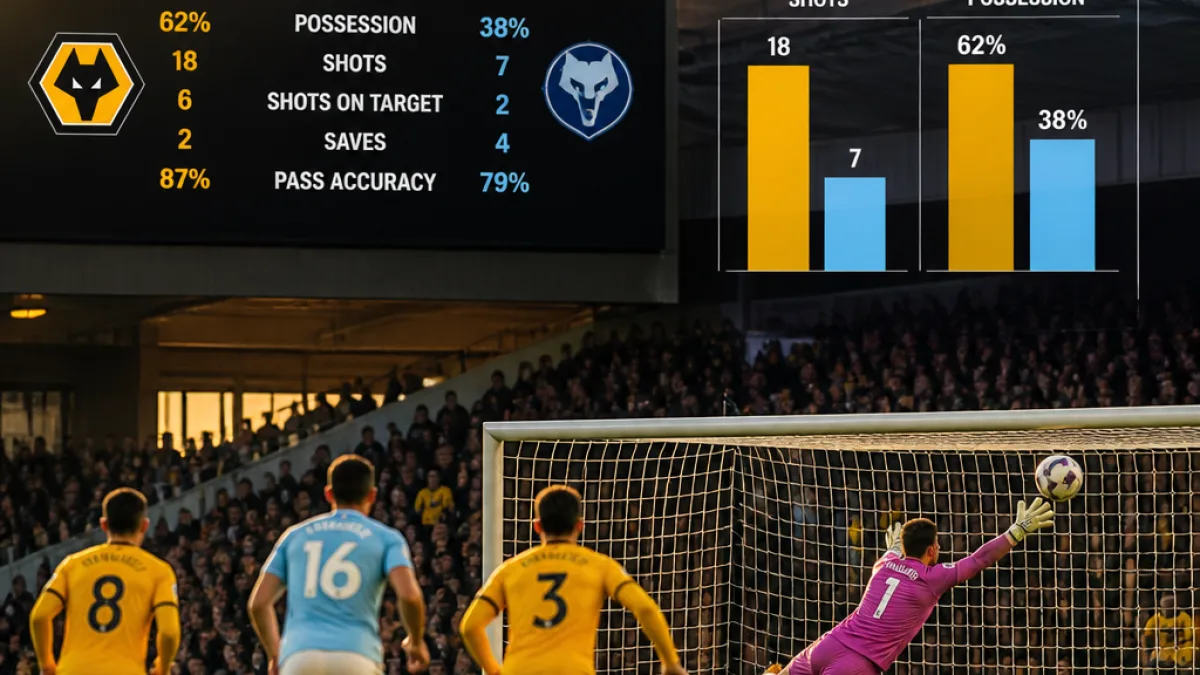
The statistical breakdown from Wolverhampton Wanderers' recent WSL fixture against Burnley paints a clear picture of which side controlled the ball and created the more dangerous opportunities — even if the headline result is not provided in the figures. Wolves registered higher possession, a greater number of shots and considerably more attempts on target, while Burnley registered a greater number of goalkeeper saves and clearances.
- Possession: Wolverhampton Wanderers 51.8%, Burnley 48.2%
- Shots (total): Wolverhampton 13, Burnley 11
- Shots on target: Wolverhampton 8, Burnley 2
Attack and chance creation
Wolves produced 13 total shots with eight on target, a strong conversion of intent into testing opportunities for the opposition goalkeeper. That is reflected in the goalkeeper saves tally: Burnley's keeper was credited with five saves while Wolves' keeper made two. Wolves completed more passes overall (442 to Burnley’s 407) and recorded a higher pass accuracy (78.7% v 72.7%), suggesting better ball retention and circulation in open play.
| Metric | Wolverhampton | Burnley |
|---|---|---|
| Total passes | 442 | 407 |
| Pass accuracy | 78.7% | 72.7% |
| Shots on target | 8 | 2 |
| Goalkeeper saves | 2 | 5 |
Distribution and forward play
Wolves completed fewer backward passes (50 v 68) and a similar number of forward passes (162 v 165), which along with 72 long balls suggests a mixed approach combining short possession sequences with direct deliveries into attacking areas. Wolves also completed more successful passes into the final third (50 v 40), underlining their emphasis on advancing play into dangerous zones.
Defence and physicality
On defensive metrics Burnley made more tackles (23 v 14) but had a slightly lower success rate (78.3% v 85.7%). Clearances were broadly comparable (Wolves 16, Burnley 14) while fouls and yellow cards were near parity. The total touches in the opposition box were 13 for Wolves and 16 for Burnley, indicating that although Wolves registered more shots on target, Burnley still found ways to penetrate the area more often.
For Wolverhampton supporters and coaching staff the data provide specific areas to consider: converting possession and high shot volumes into consistent clear-cut chances and managing defensive phases where opponents are registering many touches in the box. The passing volume and accuracy are positives to build from, but the team will be aware that goalkeeper involvement and opponents’ tackling frequency point to pressure situations that need addressing in training.